RSI without the myths: what 70 and 30 really tell you
On this page
The Relative Strength Index is on almost every chart, and it is almost always read the same way: above 70 sell, below 30 buy. That rule loses money in trending markets. RSI is a momentum gauge, and it is most useful once you know what it actually measures.
How RSI is calculated
RSI compares the size of recent up moves with recent down moves. Over the last 14 periods, the usual setting, it averages the gains on up candles and the losses on down candles, divides one by the other and squeezes the result onto a 0–100 scale: RSI = 100 − 100 ÷ (1 + average gain ÷ average loss).
Here is a widely used textbook example with 15 closing prices. The 14 changes between them add up to 3.34 of gains and 1.40 of losses.
- Average gain: 3.34 ÷ 14 = 0.2386
- Average loss: 1.40 ÷ 14 = 0.1000
- RS = 0.2386 ÷ 0.1000 = 2.386, so RSI = 100 − 100 ÷ 3.386 = 70.5
After the first value, both averages are smoothed: each new average keeps 13/14 of the previous one and adds 1/14 of the latest move. That is why RSI turns gradually instead of jumping with every candle.
Overbought is not a sell signal
A reading above 70 means gains have been much larger than losses over the last 14 periods. In a strong uptrend that can last for weeks, and shorting every move above 70 means betting against the strongest part of the trend.
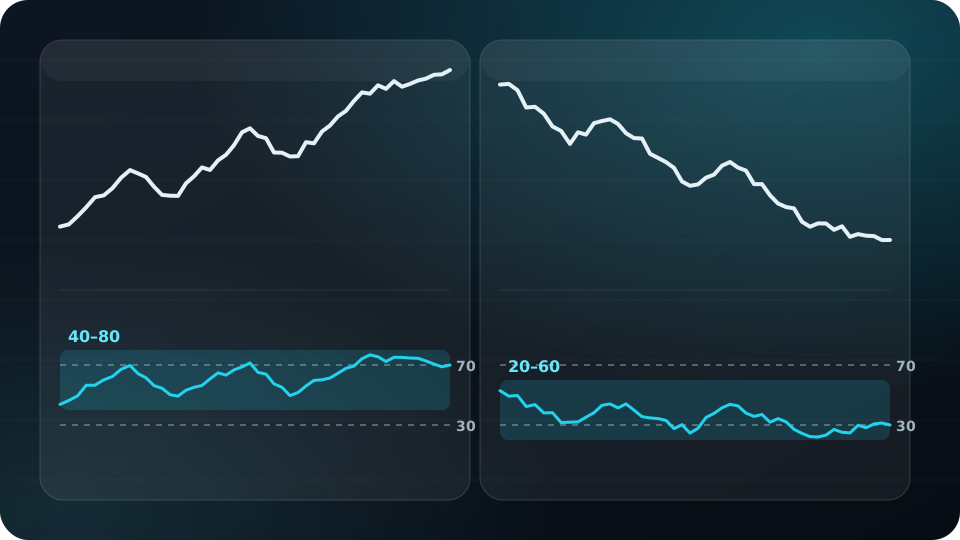
A more useful habit is to watch the range RSI holds. In healthy uptrends daily RSI often stays roughly between 40 and 80, and dips toward 40–50 are where pullbacks tend to end. In downtrends the range shifts down to roughly 20–60. These are rules of thumb, not fixed levels.
Divergence: a warning, not a trigger
When price makes a higher high but RSI makes a lower high, momentum is fading. That is bearish divergence. The mirror image, a lower low in price with a higher low in RSI, is bullish divergence.
Divergence can run for a long time before price turns, and many divergences never lead to a reversal. Treat it as a reason to tighten a stop or skip a new entry, then wait for price itself to confirm, such as a break of a support zone.
Settings and timeframes
- 14 periods is the default. Shorter settings such as 7 or 9 react faster and give more false signals; longer ones such as 21 are smoother and slower.
- The timeframe matters more than the setting. A 15-minute RSI above 70 says little about the daily trend.
- Start with the higher timeframe: use daily RSI for direction and a lower timeframe only to time the entry.
The Tradevo home page shows the live daily RSI 14 for BTC, calculated from exchange candles.
For education only, not financial advice. Trading with leverage or futures can lose more than your margin. All examples are illustrative.
Get the next guide in your inbox
One practical email a week. Free, unsubscribe anytime.
Or follow Tradevo on TelegramMarket now
Latest news