Support and resistance: draw zones, not lines

On this page
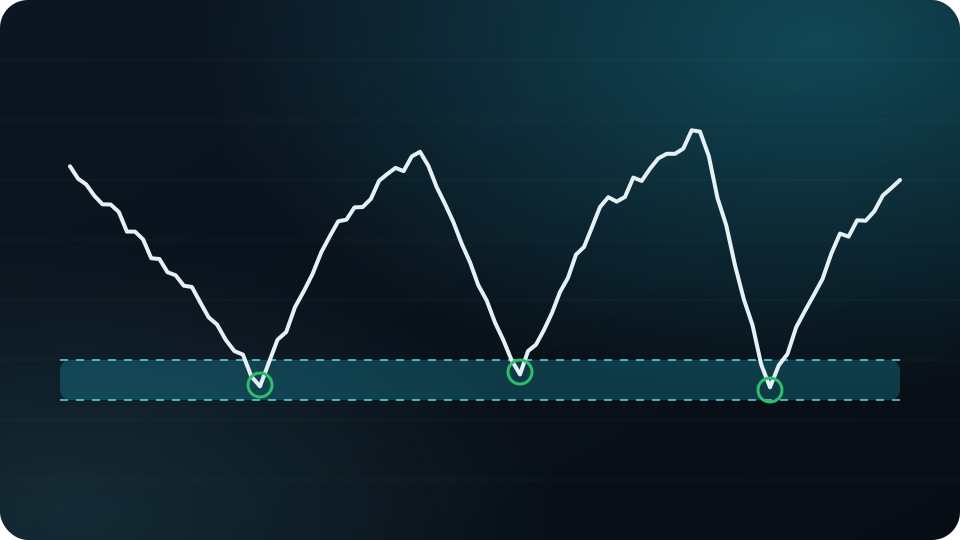
Support and resistance are price areas where buying or selling has repeatedly stepped in. They are among the most used ideas in technical analysis, and among the most misused, mostly because traders draw them as exact lines.
Why levels form
Prices that matter to many traders at once tend to attract orders: previous highs and lows, the price where a big move started, round numbers. When price returns to such an area, some traders who missed the first move act, and others close positions at break-even. That cluster of orders can slow or reverse the move.
None of this is guaranteed. A level is a place where a reaction is more likely, not a wall.
Draw zones, not lines
On a chart, mark the area where price turned several times, using candle bodies and wicks together. The result is usually a band, not a single price. Wicks poke through, closes land just short — a zone accepts that noise.
- Use a higher timeframe first (daily, 4-hour), then refine on a lower one.
- More touches and sharper reactions make a zone more relevant.
- Recent zones usually matter more than ones from years ago.
When a level breaks
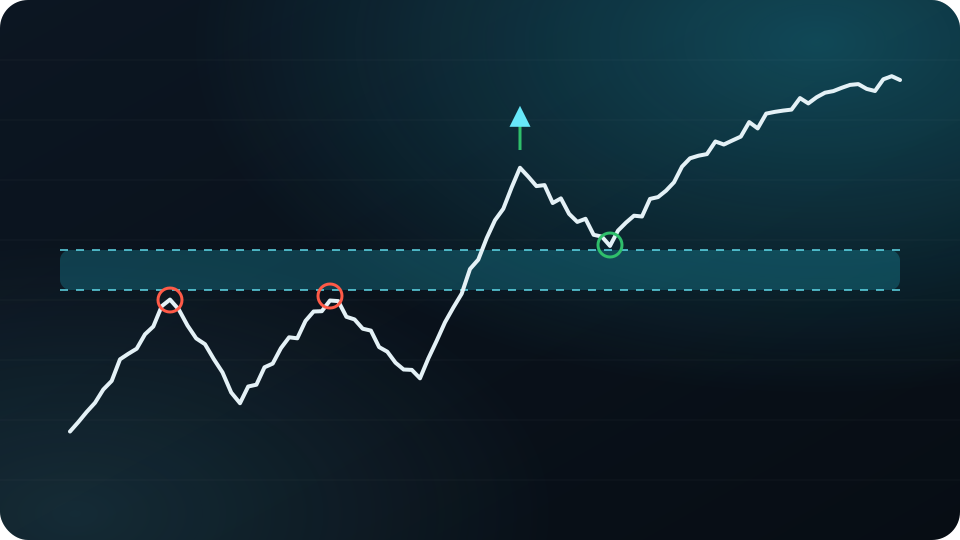
A clean close beyond the zone, ideally on rising volume, suggests the orders there have been absorbed. Broken support often turns into resistance on the way back up, and broken resistance into support. Traders call the return to the broken level a retest.
A move through the zone that quickly reverses back inside is a failed breakout. Those trap traders who entered late, and the reversal can be fast.
Common mistakes
- Drawing too many levels — if every swing gets a line, the chart stops telling you anything. Keep the few zones price reacted to most clearly.
- Treating a zone as a guarantee — each test can absorb some of the orders sitting there, so a zone tested many times in quick succession can become weaker, not stronger.
- Ignoring the bigger picture — a support zone on a 15-minute chart means little if price is falling through a daily support area at the same time.
Using zones in a plan
Zones give you places to put the parts of a trade: entries near a zone, the stop on the other side of it where the idea is wrong, and targets before the next opposing zone. Then the position size follows from the stop distance, as in our position sizing guide.
If the next opposing zone is closer than your target, the R:R you planned is not really available. Either the setup needs a better entry or it is not worth taking.
For education only, not financial advice. Trading with leverage or futures can lose more than your margin. All examples are illustrative.
Get the next guide in your inbox
One practical email a week. Free, unsubscribe anytime.
Or follow Tradevo on TelegramMarket now
Latest news