Risk-reward and expectancy: why win rate is not enough
On this page
Win rate is the number traders like to quote, but on its own it says very little. A strategy that wins 40% of the time can make money, and one that wins 60% of the time can lose it. Expectancy tells you which one you have.
Measure everything in R
R is the amount you risk on a trade — the loss if your stop is hit. If you risk 100 USDT, a trade that makes 200 USDT is +2R and a full stop-out is −1R. Measuring results in R lets you compare trades of different sizes and on different coins.
The risk-reward ratio, or R:R, is the planned target divided by the planned risk. A trade risking 1,200 dollars of price movement to make 2,400 has an R:R of 2.
Write both numbers down before you enter. An R:R calculated after the trade is over tends to flatter you, because it is easy to move the target to wherever price happened to stop.
Expectancy in one line
Expectancy is the average result per trade: win rate × average win − loss rate × average loss, all in R. A positive number means the strategy has an edge before costs.
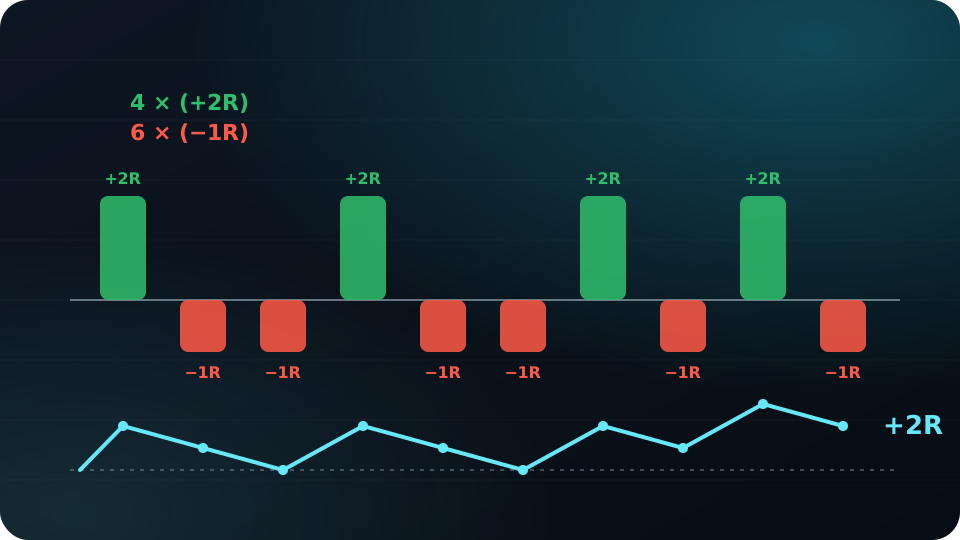
Illustrative example: you win 40% of trades at +2R and lose 60% at −1R. Expectancy is 0.4 × 2 − 0.6 × 1 = +0.2R per trade. Over ten trades that is four wins (+8R) and six losses (−6R), a net +2R. At 100 USDT per R, that is +200 USDT.
Now flip it: you win 60% of trades but take profit early at +0.5R, while losses stay at −1R. Expectancy is 0.6 × 0.5 − 0.4 × 1 = −0.1R. You win more often and still lose money.
The break-even win rate
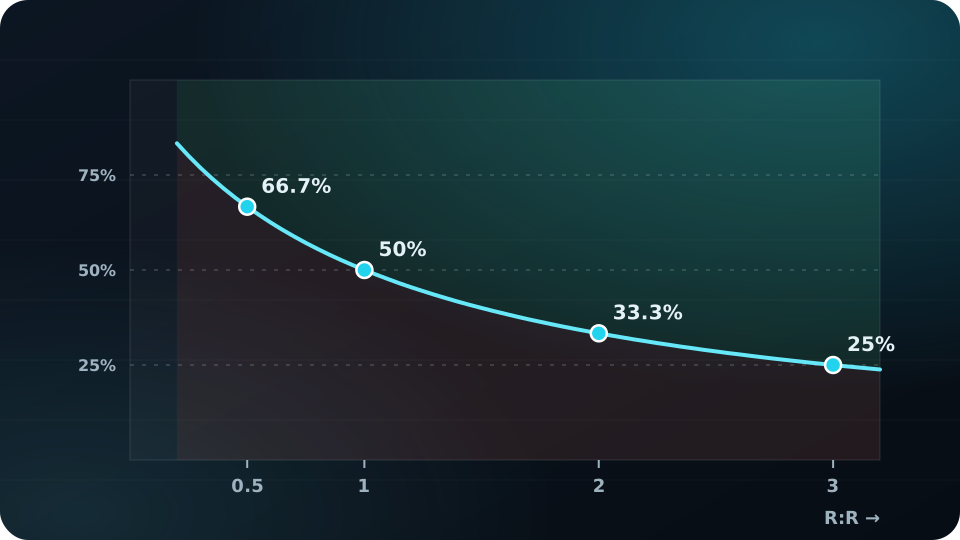
For any R:R, there is a win rate below which you lose money before fees. It equals 1 ÷ (1 + R:R):
- R:R of 0.5 → you need to win more than 66.7% of trades
- R:R of 1 → more than 50%
- R:R of 2 → more than 33.3%
- R:R of 3 → more than 25%
Where real results differ
Planned R:R is not realised R:R. Targets are missed, stops slip, and fees take a slice of every trade. If fees and slippage cost 0.1R per trade, the +0.2R edge in the example is cut in half. Your journal, not your plan, tells you your real numbers — and you need dozens of trades before they mean much.
Small samples swing a lot. Ten trades with a 40% win rate can easily produce two wins or six by chance alone, so judge a strategy on a larger set of trades taken under the same rules.
For education only, not financial advice. Trading with leverage or futures can lose more than your margin. All examples are illustrative.
Get the next guide in your inbox
One practical email a week. Free, unsubscribe anytime.
Or follow Tradevo on TelegramMarket now
Latest news