Bitcoin's $80,000-$88,000 box before the Fed: the numbers
On this page05
Numbers in this piece
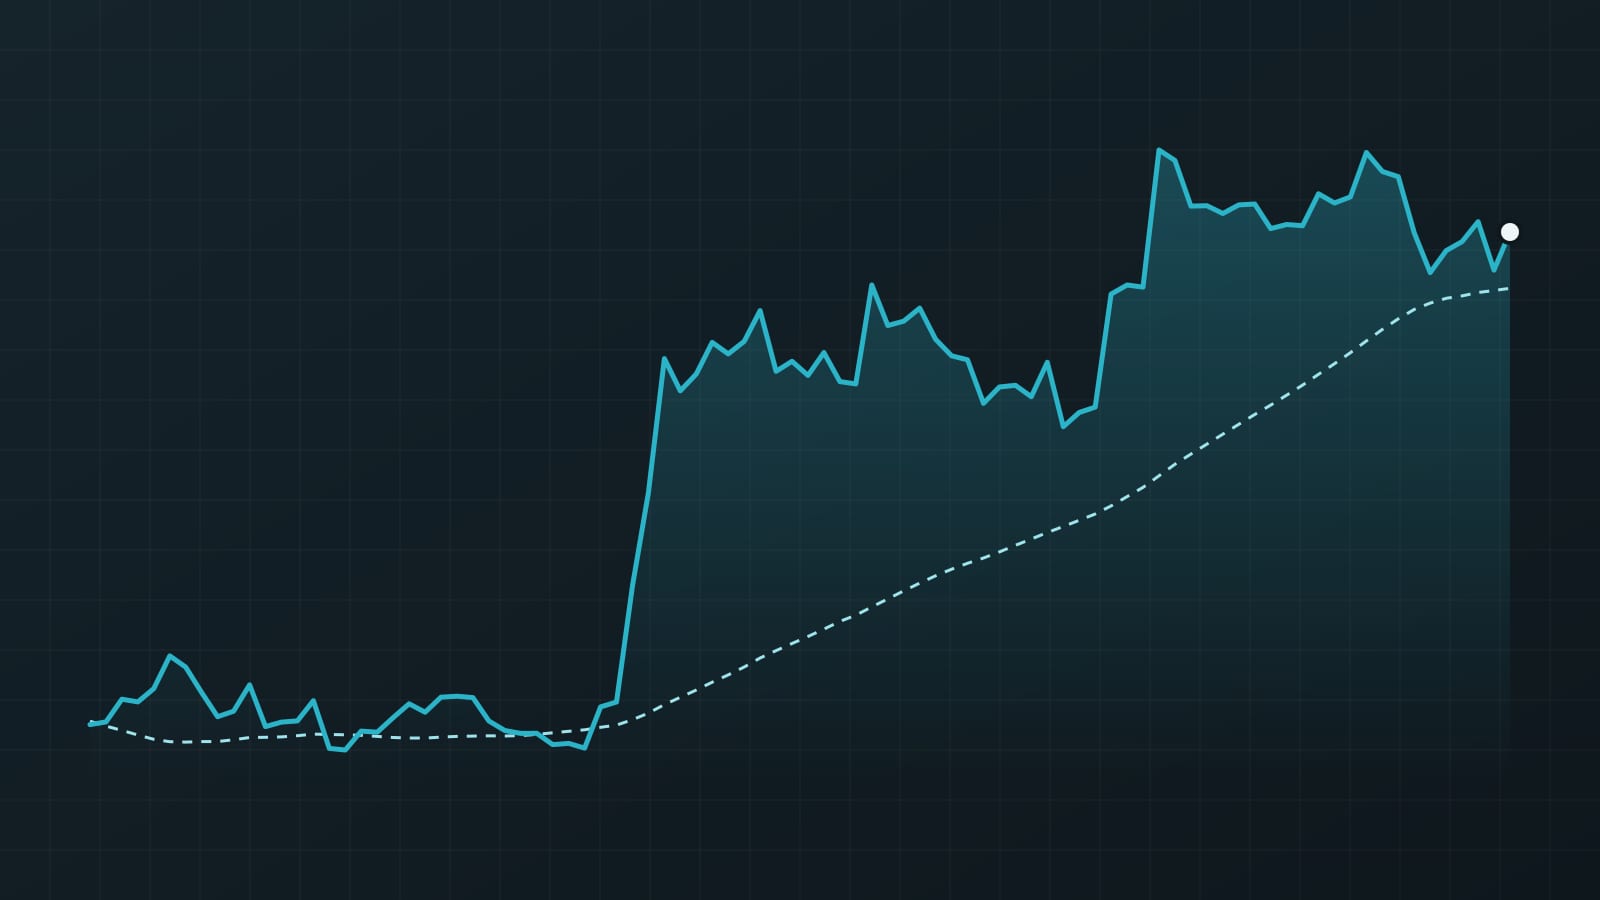
§02- Last close: $81,543, down 1.7% over 7 days, up 6.7% over 30 days and up 25.0% over 90 days.
- 90-day high close: $86,616 on 2026-09-21; price is 5.9% below it.
- 90-day low close: $62,823 on 2026-08-01; price is 29.8% above it, or 79% of the way through the 90-day range.
- 50-day simple average: $81,358; price is above it by 0.2%, so it sits almost on the average.
- Spot ETF aggregate cost basis near $81,500 and the six-to-12-month buyer cohort near $88,000, per Glassnode via CryptoSlate.
- Glassnode's True Market Mean near $78,000; a drop of 2.5% separates $80,000 and $78,000.
- +1 → §02

Bitcoin is trading inside a box of roughly $80,000 to $88,000, while the typical one-standard-deviation band up to Nov. 3 covers about $76,300 to $89,700, CryptoSlate reported. Odds of an October Fed hike fell to 15% from 27% in a day, according to Cointelegraph. This article sets those figures against Tradevo's daily data and asks what they mean for risk per trade.
What happened
On Oct. 15, bitcoin slipped under $80,000 after two hot inflation prints in two days. September CPI rose to 3.7% from 3.4%, producer prices rose 1.3% on the month, and core PPI added 0.7%, CryptoSlate reported.
A day later the tone eased. Cointelegraph reported bitcoin near $82,000 at Friday's Wall Street open, after a bounce at $80,000. Fed Chair Kevin Warsh, speaking with IMF Managing Director Kristalina Georgieva, avoided any mention of further hikes. He said: "I don’t prejudge meetings." CME FedWatch odds of a 25-basis-point October hike dropped to 15% from 27%.
Sygnum strategist Can-Luca Köymen told CryptoSlate the bank's base case is a range into the midterms. He said options price about $80,000 to $87,000 for the next four weeks or so, and the break-even levels of holders, measured on-chain, mark out much the same box.
The numbers in context
Tradevo data uses Bybit daily closes, as of 2026-10-17.
- Last close: $81,543, down 1.7% over 7 days, up 6.7% over 30 days and up 25.0% over 90 days.
- 90-day high close: $86,616 on 2026-09-21; price is 5.9% below it.
- 90-day low close: $62,823 on 2026-08-01; price is 29.8% above it, or 79% of the way through the 90-day range.
- 50-day simple average: $81,358; price is above it by 0.2%, so it sits almost on the average.
- Spot ETF aggregate cost basis near $81,500 and the six-to-12-month buyer cohort near $88,000, per Glassnode via CryptoSlate.
- Glassnode's True Market Mean near $78,000; a drop of 2.5% separates $80,000 and $78,000.
- ETF flows: nearly $3 billion in from Sept. 21 to Oct. 6, then a net $859 million out from Oct. 7 to Oct. 14, with the final day alone at $261.4 million.
Read together: the last close sits within a few hundred dollars of both the 50-day average and the ETF cost basis. That is the lower half of the box, not the top edge.
Two ranges, two different jobs
The $80,000 to $88,000 box comes from where holders break even. The $76,300 to $89,700 band comes from 35.46% 30-day implied volatility, from Derivasys, applied to an $83,000 start. Implied volatility is the size of swing the options market is pricing, expressed in percent.
The volatility band is wider than the box on both sides. Price can touch a box edge and still sit well inside the volatility band. For stop placement, that matters: a stop parked just under a widely watched level sits inside the normal range of noise.
What this means for risk per trade
Size follows the distance to the stop, not conviction. Fix the amount you are willing to lose first, then divide it by the stop distance. A wider stop means a smaller position for the same risk.
Here the obvious levels are close together. Bitget analyst Lewis Huang flagged a confirmed close below $79,960 as a breakdown signal, with $78,000 next. A stop under $80,000 and a stop under $78,000 are 2.5% apart, so the same risk budget buys noticeably different sizes depending on which one a plan uses.
Event days add gap risk: price can move past a stop before it fills. Into scheduled releases, some traders cut size rather than tighten stops, so that a gap costs a known, smaller amount.
The next numbers to watch
Three dates fall in sequence.
- Oct. 28: Fed rate decision. The current range, set by a Sept. 16 hike, is 3.75% to 4.00%; the Fed projects a 4.1% rate for end-2026.
- Oct. 29: September PCE inflation.
- Nov. 3: U.S. midterm elections. CryptoQuant data showed gains of 24.5%, 44.9% and 92.3% in the 12 months after the 2014, 2018 and 2022 midterms, but three cycles are too few to isolate an effect.
Cross-market inputs remain loud: Cointelegraph put the US 10-year yield at 5.07% after a brief 5.13%, and Korea's KOSPI ended at 5,668: a 2% daily gain inside a weekly loss of 8.3%.
Sources
- CryptoSlate · October 16, 2026
- Cointelegraph · October 16, 2026
Written with AI assistance from the reports named above. Figures, quotes and sources are checked automatically before publishing.
For education only, not financial advice. Trading with leverage or futures can lose more than your margin. All examples are illustrative.
Get the next guide in your inbox
One practical email a week. Free, unsubscribe anytime.
Or follow Tradevo on TelegramMarket now
Latest news