Bitcoin volatility at 43%: what it means for size
On this page04
Numbers in this piece
§02- Volatility over the past year: 43% (Grayscale).
- 10-year average volatility: 64%; five years ago: 81%.
- Share of S&P 500 constituents more volatile than bitcoin: 19%.
- Last Bybit daily close: $81,997, down 0.8% over 7 days, up 7.6% over 30 days and up 26.7% over 90 days.
- 90-day high close: $86,616 on 2026-09-21; price is 5.3% below it.
- 90-day low close: $62,823 on 2026-08-01; price is 30.5% above it.
- +2 → §02

Bitcoin's volatility over the past year has dropped to 43%, against a 10-year average of 64% and 81% five years ago, according to Grayscale research reported by Bitcoin Magazine. The study says bitcoin now swings less than 19% of S&P 500 constituents. This article looks at what a lower volatility figure changes for stop distance, risk per trade and position size, and what it does not change.
What Grayscale found
Grayscale, a crypto asset manager, compared bitcoin's realized volatility with the stocks in the S&P 500. Realized volatility measures how widely price actually moved over a past window, expressed as an annual percentage. By that measure, Bitcoin Magazine reported, bitcoin now sits inside the range of S&P 500 members, and a meaningful number of large-cap US stocks moved more than it did.
Zach Pandl, Grayscale's head of research, set out the findings in a Wednesday note. He linked the decline to deeper liquidity, wider institutional participation and more regulated ways to access the asset. Bitcoin Magazine added that K33 Research data from December showed 2025 was bitcoin's least volatile year on record, and tied the change to more investors entering, especially after US spot bitcoin ETFs were approved in 2024.
The numbers in context
Volatility figures describe the past. Price figures show where the market stands today. Here are both, side by side.
- Volatility over the past year: 43% (Grayscale).
- 10-year average volatility: 64%; five years ago: 81%.
- Share of S&P 500 constituents more volatile than bitcoin: 19%.
- Last Bybit daily close: $81,997, down 0.8% over 7 days, up 7.6% over 30 days and up 26.7% over 90 days.
- 90-day high close: $86,616 on 2026-09-21; price is 5.3% below it.
- 90-day low close: $62,823 on 2026-08-01; price is 30.5% above it.
- Position in the 90-day range: 81% of the way from the low to the high.
- 50-day average: $81,292; price is above it by 0.9%.
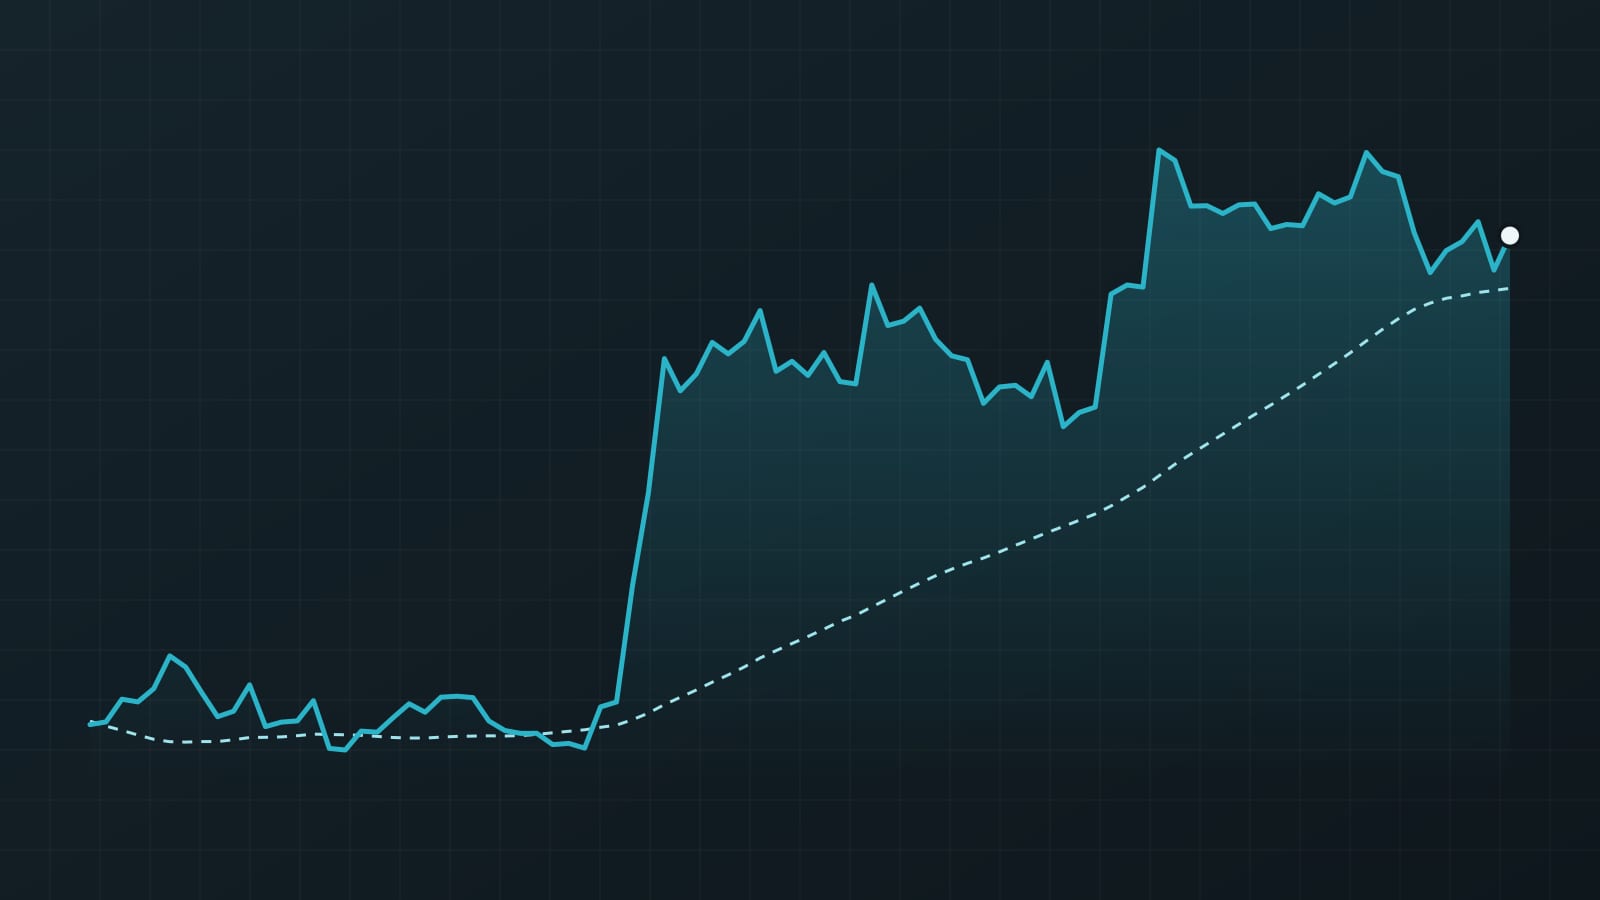
The 90-day data shows that a lower annual volatility figure still leaves room for large moves. Price travelled from a $62,823 close to a $86,616 close inside one quarter. Bitcoin Magazine also noted that at one stage in 2026 bitcoin was more than 50% below the all-time high it set last October, and that the recent price of $82,485 was 35% under the $126,080 record.
What lower volatility means for risk per trade
Pandl framed the shift this way: "That shifts the question from whether to own a volatile asset to how to size an allocation." For a trader, sizing is a mechanical step. You decide how much of the account you are willing to lose if the stop is hit. Then you divide that amount by the distance from entry to stop. Size follows the stop distance, not conviction.
Volatility feeds into that stop distance. When daily ranges are wider, a stop placed outside normal noise has to sit further away, so the position gets smaller for the same risk. When ranges narrow, the same stop logic produces a closer stop and a larger position for an unchanged amount at risk. The risk per trade stays the same in both cases; only the size changes.
The trap is to read a lower volatility figure as lower risk and raise the amount at risk instead. A year-long average smooths out bursts. It does not cap the next move, and a gap through a stop can still produce a loss bigger than planned.
Where the figure can mislead
An annual figure hides clusters. Quiet weeks pull the average down while a few violent days do most of the damage. Bitcoin Magazine pointed out that bitcoin's early history included drawdowns above 80% within months, and that the August rally came after news that the US Treasury would at least double its liquidity-support buyback operations. Macro headlines like that can change the range quickly.
A practical habit is to measure volatility over the same window you trade. A swing trader holding for days cares more about recent daily ranges than about a 10-year average. Recalculating the stop from current ranges, rather than from a headline number, keeps size tied to what the market is doing now.
Sources
- Bitcoin Magazine · October 15, 2026
Written with AI assistance from the reports named above. Figures, quotes and sources are checked automatically before publishing.
For education only, not financial advice. Trading with leverage or futures can lose more than your margin. All examples are illustrative.
Get the next guide in your inbox
One practical email a week. Free, unsubscribe anytime.
Or follow Tradevo on TelegramMarket now
Latest news