Bitwise's Q3 review by the numbers: swings and size
On this page04
Numbers in this piece
§02- Bitwise large-cap index: up 46.4% in Q3, down 6.2% year-to-date through September.
- Bitcoin: up 42.3% in Q3 per Bitwise. Last close $81,132; down 0.8% over 7 days, up 7.3% over 30 days, up 25.1% over 90 days.
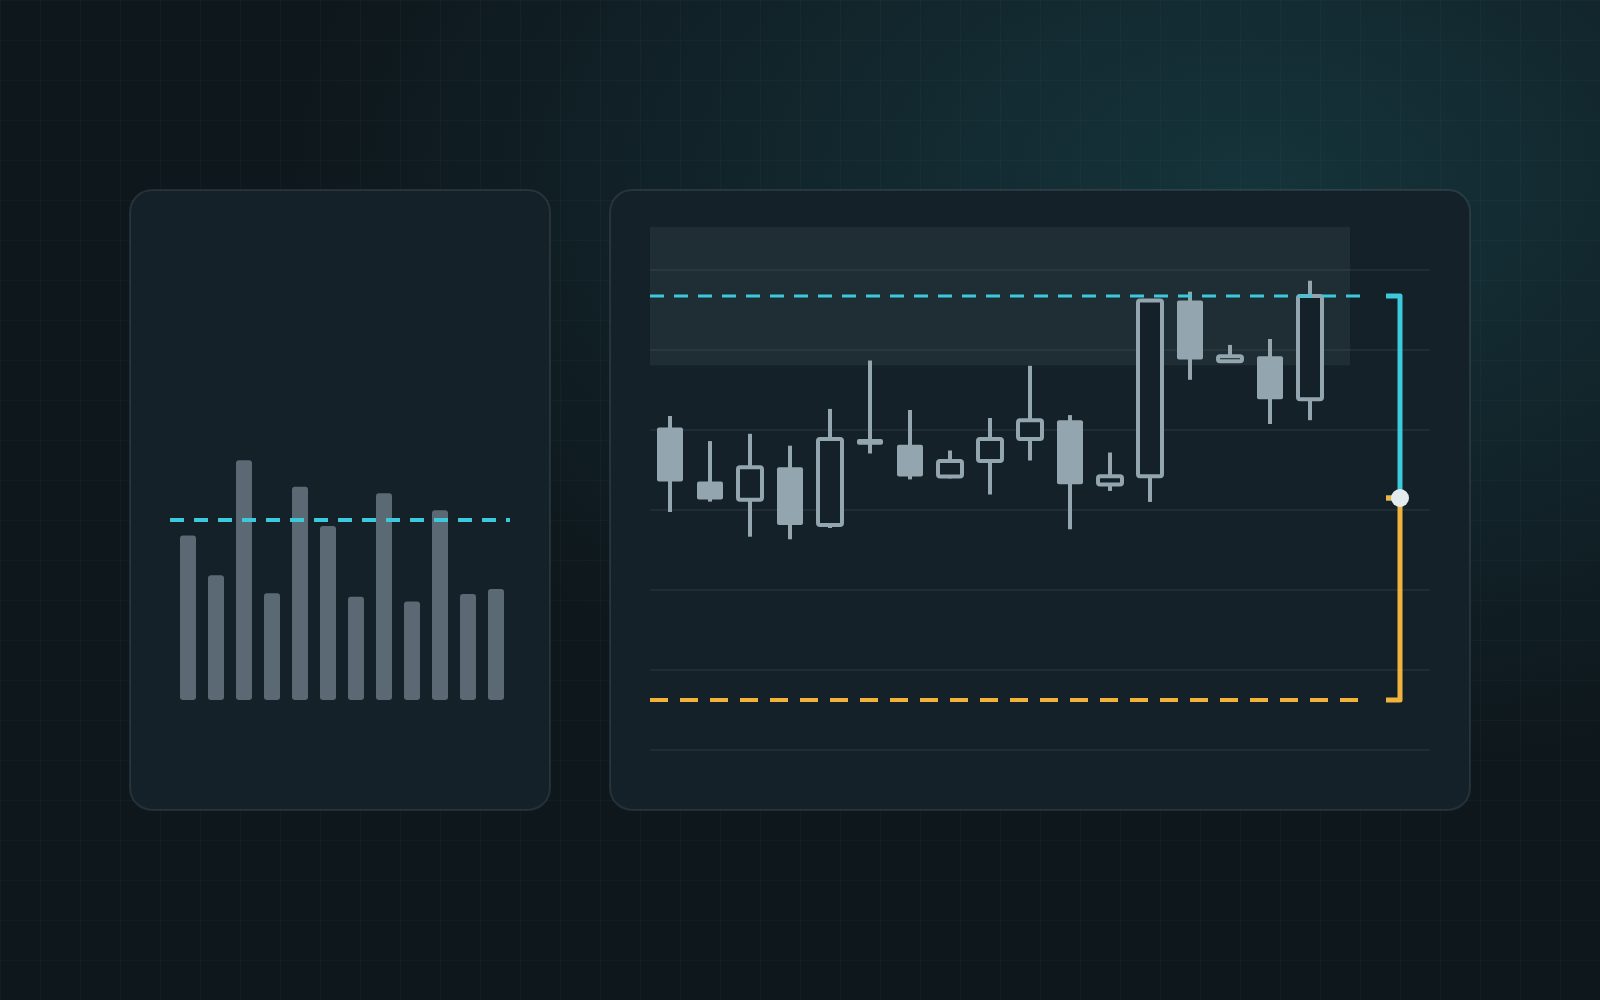
- Bitcoin's range: 6.3% below the 90-day high close of $86,616 and 29.1% above the 90-day low close of $62,823, at 77% of the range.
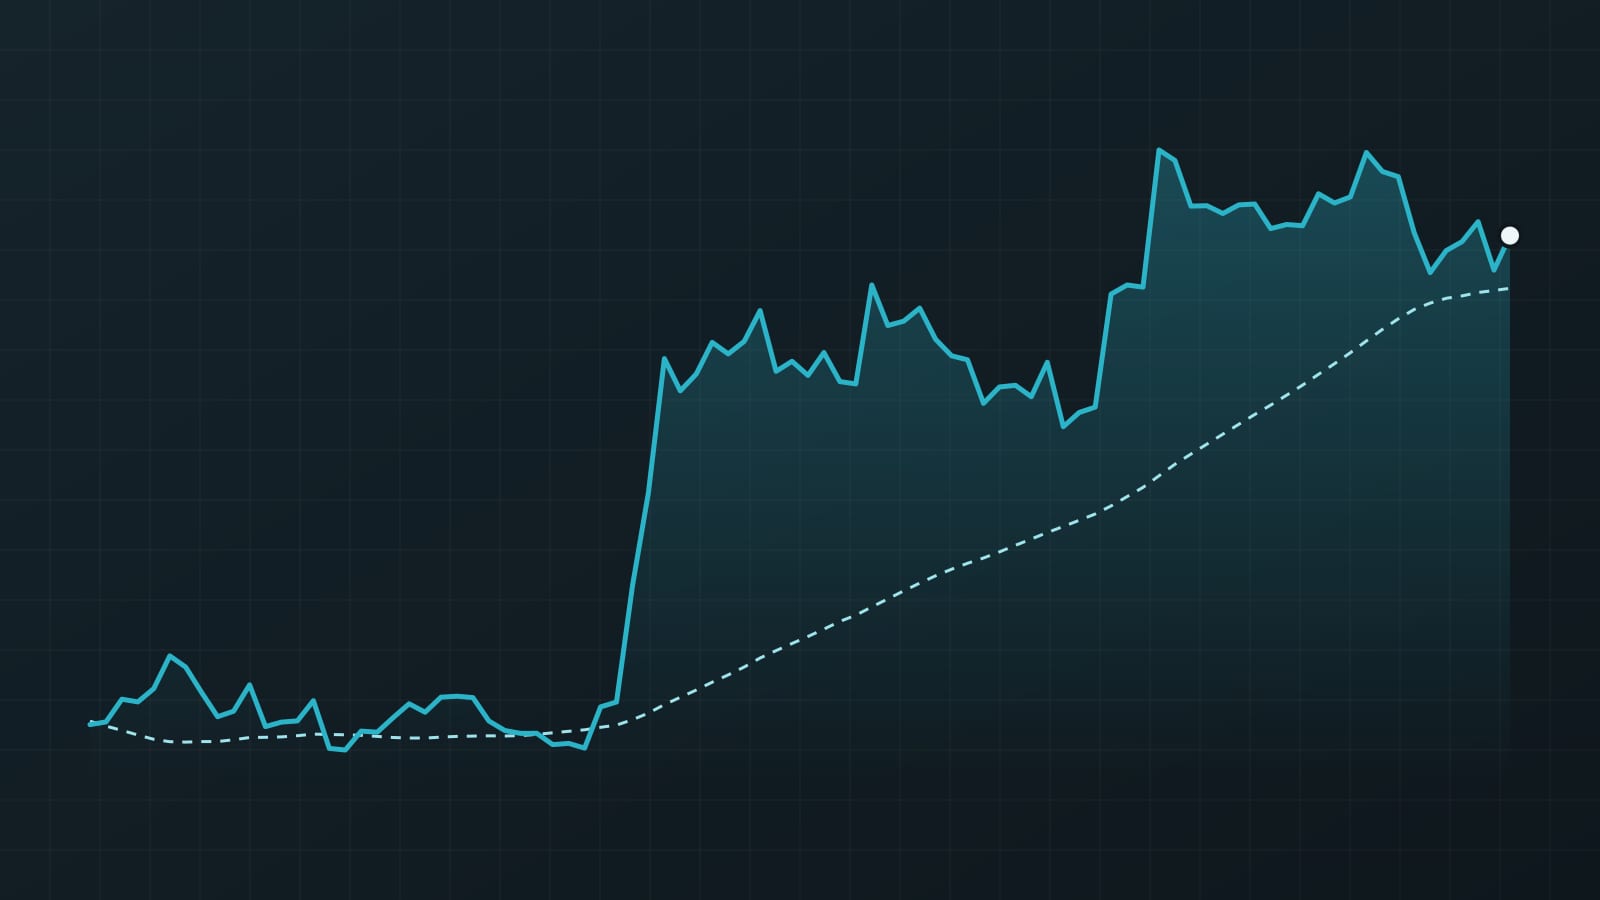
- Bitcoin vs its 50-day average of $81,235: below it by 0.1%, effectively on the line.
- Ether: up 69.1% in Q3, but down 4.5% over 7 days and down 1.4% over 30 days; 14.8% below its 90-day high and 7.4% below its 50-day average.
- Solana: up 59.2% in Q3; down 6.8% over 7 days, 16.3% below its 90-day high close of $122.14.
- +1 → §02

The Bitwise large-cap crypto index gained 46.4% in the third quarter, yet it still showed a 6.2% loss year-to-date at the end of September. Bitcoin rose 42.3% in the quarter, Cointelegraph reported. This article reduces the review to those few figures and asks what swings of that size mean for risk per trade.
What Bitwise reported
Bitwise published its quarterly market review on Thursday, according to Cointelegraph. Matt Hougan, the firm's chief investment officer, wrote that Q3 may rank among the strongest quarters in crypto's history. He framed it against where the market stood before the rally: "Three months ago, crypto was in the depths of despair," Hougan said, adding that prices, on-chain activity and ETF flows had all been falling.
The gains were broad. All 10 coins in the Bitwise large-cap index posted double-digit quarterly gains. Ether rose 69.1%, Solana 59.2% and Chainlink led with 97.6%. US spot bitcoin ETFs took in $6 billion of net inflows, enough to turn their year-to-date flows positive again.
The quarter was not uniform, though. Shares of miners lost ground, with Riot Platforms down 26.4% and Hut 8 down 25.4%, while Galaxy Digital lost 16.8%, Bitwise said. And analysts still disagree on whether the slump is over: CryptoQuant said in September its indicators confirmed a new bull market, while Bitget's chief analyst Ryan Lee said a bottom needed more confirmation.
The numbers in context
Tradevo's data uses daily closes. The 90-day range is the highest and lowest close of the last 90 days; the 50-day average is the simple mean of the last 50 closes.
- Bitwise large-cap index: up 46.4% in Q3, down 6.2% year-to-date through September.
- Bitcoin: up 42.3% in Q3 per Bitwise. Last close $81,132; down 0.8% over 7 days, up 7.3% over 30 days, up 25.1% over 90 days.
- Bitcoin's range: 6.3% below the 90-day high close of $86,616 and 29.1% above the 90-day low close of $62,823, at 77% of the range.
- Bitcoin vs its 50-day average of $81,235: below it by 0.1%, effectively on the line.
- Ether: up 69.1% in Q3, but down 4.5% over 7 days and down 1.4% over 30 days; 14.8% below its 90-day high and 7.4% below its 50-day average.
- Solana: up 59.2% in Q3; down 6.8% over 7 days, 16.3% below its 90-day high close of $122.14.
- Chainlink: up 97.6% in Q3; 21.4% below its 90-day high close of $15.45 and 50.4% above its 90-day low.
Two things stand out. A 46.4% quarter can sit inside a negative year, so a strong quarter says little about the drawdown that came before it. And the strongest Q3 performers are now the furthest below their 90-day highs, which is what large swings look like in both directions.
What this means for risk per trade
Risk per trade is the amount of account equity you accept losing if your stop is hit. Position size then follows from the distance between entry and stop, not from how confident you feel about the story.
Wide quarterly moves usually come with wide daily ranges. When a coin can travel from 50.4% above its 90-day low to 21.4% below its high, as Chainlink's data shows, a sensible stop has to sit further from entry. A wider stop at the same risk per trade means a smaller position. That is the main practical lesson of a quarter like this one.
The same logic works across assets. Bitcoin's 90-day swing was narrower than Chainlink's, so the same stop rule applied to bitcoin generally permits a larger position than for Chainlink. Treat that as a consequence of volatility, not a ranking of which asset is better.
Leverage adds a second layer. Cointelegraph reported open interest on decentralized perpetual futures at a record near $26 billion. Leverage changes how fast losses arrive, not where your stop should be.
The next numbers to watch
The review gives no fixed release date for the next data point. The practical checks are ongoing: whether bitcoin holds near its 50-day average, how far each asset sits from its 90-day high, and whether ETF flows stay positive for the year. Each of those changes the volatility backdrop that sets stop distance and size.
Sources
- Cointelegraph · October 14, 2026
Written with AI assistance from the reports named above. Figures, quotes and sources are checked automatically before publishing.
For education only, not financial advice. Trading with leverage or futures can lose more than your margin. All examples are illustrative.
Get the next guide in your inbox
One practical email a week. Free, unsubscribe anytime.
Or follow Tradevo on TelegramMarket now
Latest news