CPI week by the numbers: rate odds, yields and bitcoin
On this page
US headline inflation is expected at 3.7% when September CPI is released on Wednesday, up from 3.4% in August. CME FedWatch puts the odds of an Oct. 28 hike at 18.8%, while bitcoin's weekly close marked a 3.2% loss. This article lists the figures that matter this week and what they mean for risk per trade.
What is on the calendar
According to Cointelegraph, the September Consumer Price Index is due Wednesday and the Producer Price Index on Thursday. Both land ahead of the Federal Reserve's Oct. 28 rate meeting. CoinDesk's week-ahead note added that third-quarter bank earnings will give a separate read on lending, trading and investor demand.
Fed chair Kevin Warsh is also due to speak with IMF managing director Kristalina Georgieva at a Friday event in Bangkok.
The inflation and rate figures
CPI measures the change in consumer prices. The headline figure includes food and energy; core excludes them. August CPI came in at 3.4% year on year. Markets expect 3.7% this time, linked to Middle East fighting and higher fuel prices, Cointelegraph reported. CoinDesk said core annual inflation is expected at 2.5%, so the headline forecast would mark a reacceleration. PPI, which tracks producer prices, is forecast at 0.3% month on month after 0.2% in August.
The Fed funds target range is 3.75-4.00%. CME FedWatch puts the chance of a hike on Oct. 28 at only 18.8%. December carries 70.6% odds of a 25 basis point rise to 4.00-4.25%.
Energy is the link. WTI crude traded near $91.50 a barrel on Monday, 2% above a session low of $89.60. AAA put average diesel at $6.26 a gallon, against a Sept. 22 record of $6.52.
KCM Trade's chief market analyst, Tim Waterer, told Reuters that "a cooler-than-expected US inflation reading would be the clearest near-term catalyst". Cointelegraph noted that lower-than-expected inflation has historically helped crypto, stocks and gold by reducing the odds of Fed tightening. The reverse case is the risk: a hotter print moves rate odds the other way.
The numbers in context
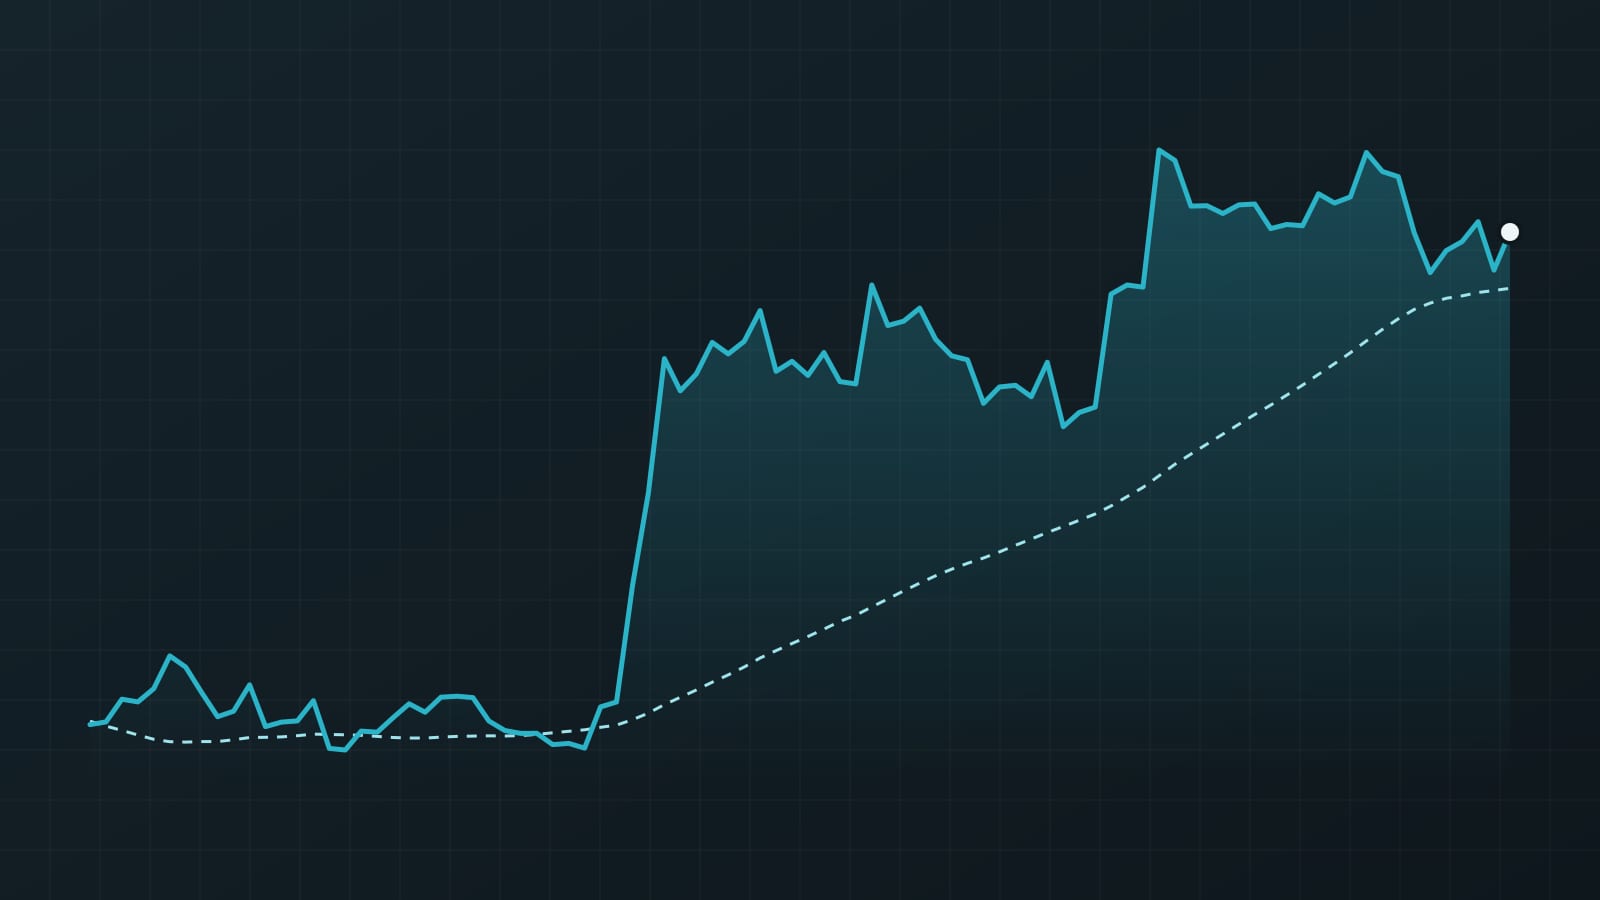
Tradevo's figures use Bybit daily closes as of 2026-10-12. Changes are over 7, 30 and 90 days; the average is the simple mean of the last 50 closes.
- Bitcoin last close: $82,780; CoinDesk put BTC just above $83,000 on Monday, with gold near $4,180 an ounce, both off about -0.5%.
- 7 days: down 3.5%. 30 days: up 7.1%. 90 days: up 27.8%.
- 90-day high close $86,616 on 2026-09-21; price is below it by 4.4%.
- 90-day low close $62,823 on 2026-08-01; price is above it by 31.8%.
- Position in the 90-day range: 84% of the way from low to high.
- 50-day average: $81,064; price is above it by 2.1%.
- US 10-year yield 5.24% and 30-year 5.60% on Monday, off 24-year highs reached last week. DXY firm above 102.4.
On the weekly chart, Cointelegraph reported a Sunday close near $83,700 on Bitstamp, a 3.2% weekly loss, with weekly support at $82,500 still intact. Holding that level kept BTC out of its earlier long-term band of $60,000 to $80,000.
What this means for risk per trade
Scheduled data releases widen the range of outcomes in a short window. Price can gap through a stop rather than fill at it. That is slippage risk, and it is larger around a release than on a quiet day.
The principle does not change: size follows the distance to the stop. If a trader widens the stop to absorb release volatility, the position must shrink so the loss in account terms stays the same. Keeping a fixed risk per trade, and measuring size from the stop, means a surprise CPI print costs a known amount rather than an unknown one.
The next numbers to watch
CPI on Wednesday and PPI on Thursday, then the shift in FedWatch odds for Oct. 28 and December. Watch the 10-year and 30-year yields and the dollar index alongside them. S&P 500 futures rose 0.25% to start the week, about 30 points short of a record, so equities offer a second read on risk appetite.
Sources
- Cointelegraph · October 12, 2026
- CoinDesk · October 12, 2026
- CoinDesk · October 12, 2026
Written with AI assistance from the reports named above. Figures, quotes and sources are checked automatically before publishing.
For education only, not financial advice. Trading with leverage or futures can lose more than your margin. All examples are illustrative.
Get the next guide in your inbox
One practical email a week. Free, unsubscribe anytime.
Or follow Tradevo on TelegramMarket now
Latest news